Hybridization and Speciation | Natural History Museum Stuttgart

Convergent evolution of arid-adapted passerines
Background
Questions
Implications
Team
What are the genomic basis of convergent evolution and how do they interact to drive phenotypic diversity?
Insights into the processes underpinning convergent evolution advance our understanding of the contributions of ancestral, introgressed, and novel genetic variation to phenotypic evolution. Phylogenomic analyses characterizing genome-wide gene tree heterogeneity can provide first clues about the extent of incomplete lineage sorting and of introgression and thereby into the potential of these processes or novel mutations to underpin convergent evolution. Here, we were interested in understanding the processes involved in convergent evolution in open-habitat chats (wheatears of the genus Oenanthe and their relatives).
We employed whole-genome resequencing data from 50 taxa of 44 species to answer:
-
Did the species tree confirm the presence of abundant convergent evolution in this group?
-
How did the gene trees vary across the genome?
-
Could ILS and introgression can explain the heterogeneity observed in the gene trees?
These results confirmed the pattern of abundant convergent evolution, especially in wheatears. The high levels of gene tree heterogeneity in wheatears were explained by ILS alone only for 30% of internal branches. For multiple branches with high gene tree heterogeneity, D-statistics and phylogenetic networks identified footprints of introgression. Finally, long branches without extensive ILS between clades sporting similar phenotypes provided suggestive evidence for the role of novel mutations in the evolution of these phenotypes. Together, our results suggested that convergent evolution in open-habitat chats involved diverse processes and highlighted that phenotypic diversification is often complex and best depicted as a network of interacting lineages.
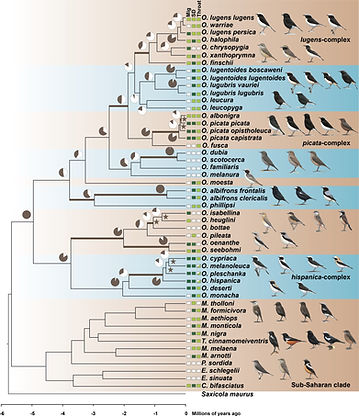
Fig. 1 Time-calibrated phylogenetic tree of open-habitat chats and levels of ILS. All nodes are supported by bootstrap values of 100. Pie charts depict the gene tree heterogeneity for each internal branch, with the brown proportion indicating the proportion of concordant gene trees. Coloured branches indicate internal branches for which ILS alone is statistically sufficient to explain the observed gene tree heterogeneity. Stars indicate branches that are in the phylogenetic anomaly zone. The character states of three selected characters: Sexual dimorphism (SD), monomorphic female-type (white), monomorphic male-type (pale green), dimorphic (dark green); Migratory behaviour (Mig), sedentary (white), short-distance migrant (pale green), long-distance migrant (dark green); and throat coloration (throat), white (white), black (pale green), and polymorphic (white and pale green). Drawing courtesy of Chris Rose (www.chrisrose-artist.co.uk) with permission from Bloomsbury Publishing Plc.